Passenger Case Study
As organisations grow, maintaining alignment and clear communication becomes increasingly challenging. For Passenger, a mobile ticketing solutions provider, these challenges came to a head as their team structure struggled to keep up with rapid growth and shifting user needs. Using User Needs Mapping, Passenger was able to uncover opportunities for better alignment, reduce cognitive load, and improve the flow of value delivery. This case study explores how they achieved these results.
From chaos to clarity: How Passenger aligned teams with User Needs Mapping
The challenge: Growing pains in a scaling organisation
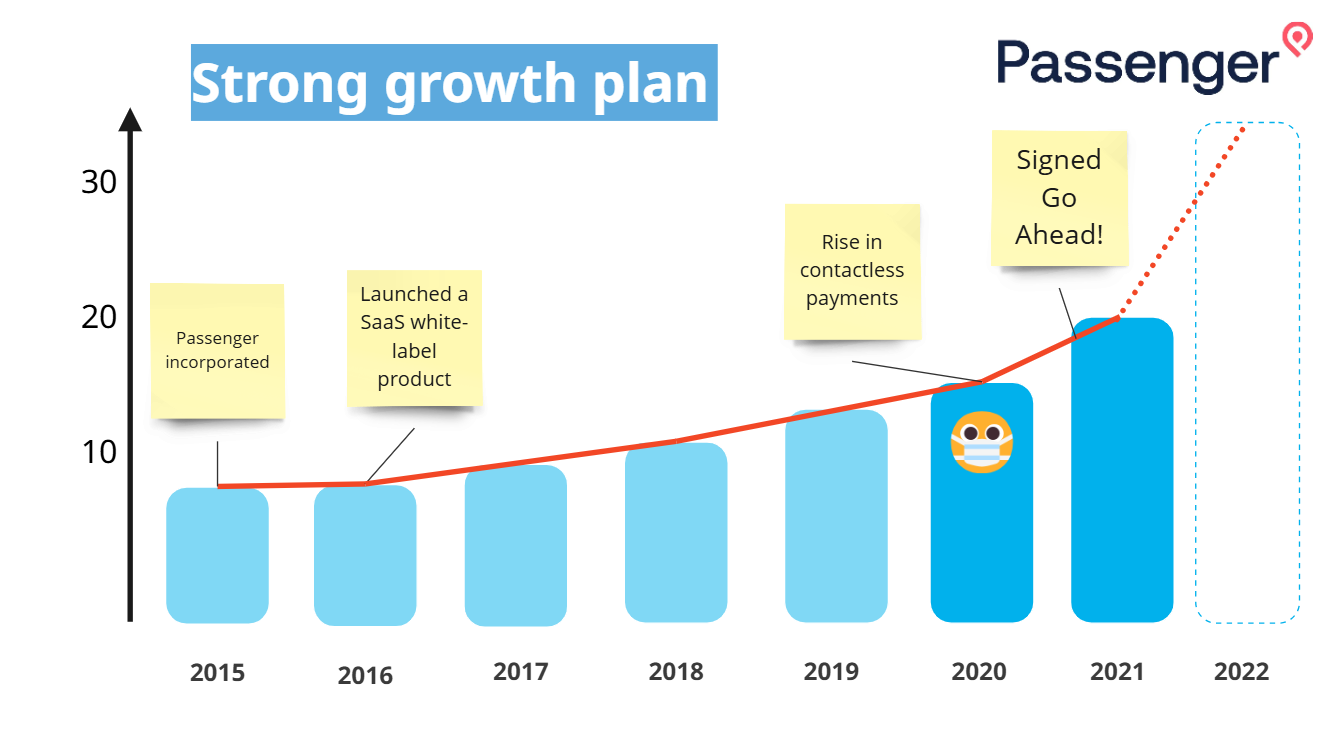
Passenger began as a small, tightly knit team in 2015, offering white-label mobile ticketing solutions for public transport operators. By 2020, they had grown significantly, fueled by a global shift toward contactless payments during the COVID-19 pandemic. The team landed a major deal with Go-Ahead, one of the UK’s largest transport operators, and demand for their solutions surged.
However, with this growth came challenges:
Overloaded communication channels: Daily standups involved nearly everyone because it was the only way to stay informed.
Unclear responsibilities: With one large team owning all capabilities, there was no clear ownership, leading to inefficiencies and bottlenecks.
Cognitive overload: Teams struggled to manage the increasing complexity of their work.
When describing the current situation, Dave Hulbert, Passenger’s CTO, said: “It just all feels like a big ball of mud.”
Passenger needed a way to restructure their teams and align their capabilities to better serve their users while reducing cognitive load.
The solution: Applying User Needs Mapping
Passenger turned to User Needs Mapping as a practical tool to identify user needs, map organisational capabilities, and define clearer team boundaries. Here’s how they applied the process:
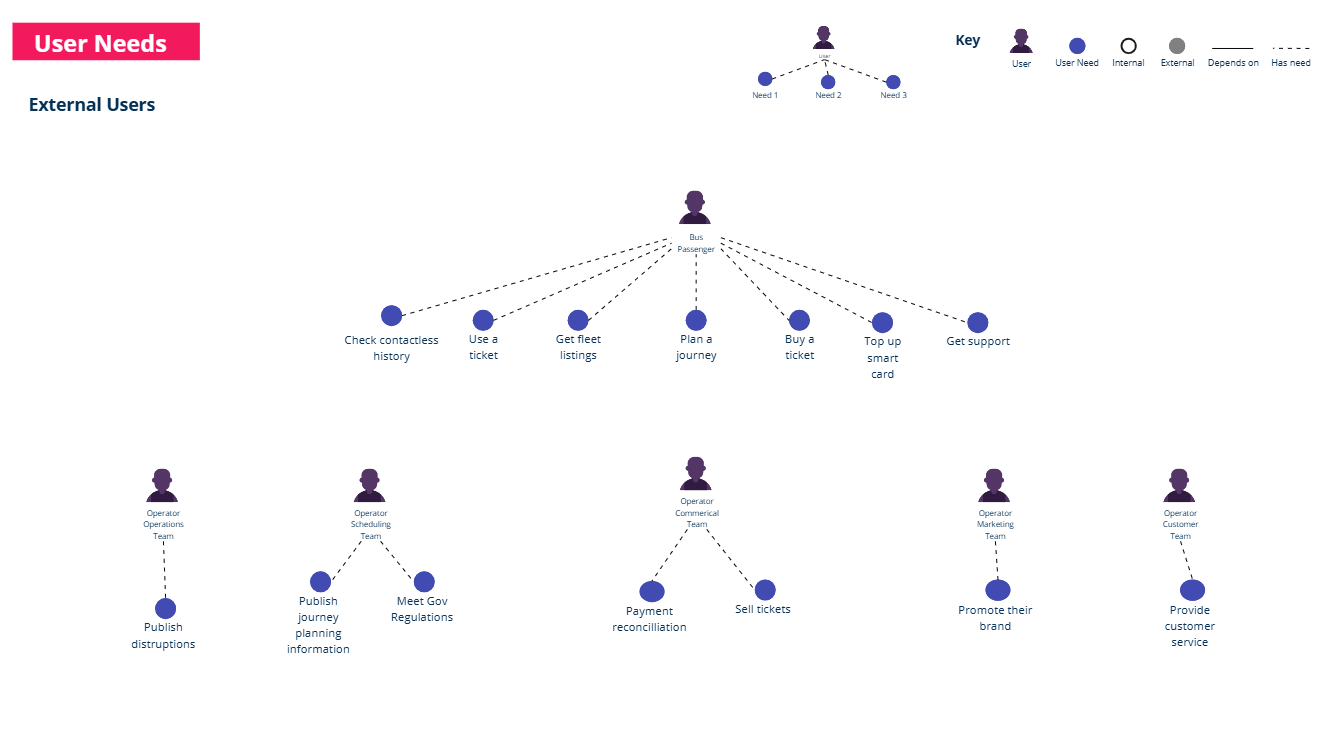
The first step was to identify all the users interacting with Passenger’s systems. This included:
External users:
Bus passengers who needed to plan journeys, buy tickets, and board buses.
Transport operators’ scheduling and marketing teams.
Internal users:
Customer service teams who relied on internal tools to support end-users.
Next, they defined the needs of each user group, focusing on verbs to describe their needs. For example, in the workshop the team defined initially defined the following needs:
A bus passenger might need to:
Buy a ticket.
Use the ticket to board a bus.
Plan their journey.
A scheduling team might need to:
Publish accurate timetable data.
Meet government reporting requirements.
Some of these needs are not really needs but actually actions that the user can take. This is very common when people are new to User Needs Mapping. When we try to describe and capture the user journey as a starting point it is generally more natural to describe the actions or activities that the user is taking rather than exploring and capturing the underlying needs that the user has. This is still a very valuable place to start the conversation. We don’t necessarily want to get bogged down into the perfect definition of a need as this can stall progress. It is important though, to revisit the initially captured needs at a later stage to refine them and help explore opportunities for innovation.
For example, the need to “Use the ticket to board a bus” could be reframed as “Quick and easy access to transport” or the “Buy a ticket” could be reframed as a combination of needs such as “Be able to travel to my destination” or “Know I have valid access to travel”. Looking at the needs in this way can help explore opportunities for innovation such as a “Pay as you go” option or a “Travel pass” that can be used on multiple modes of transport such as eScooters or eBikes.
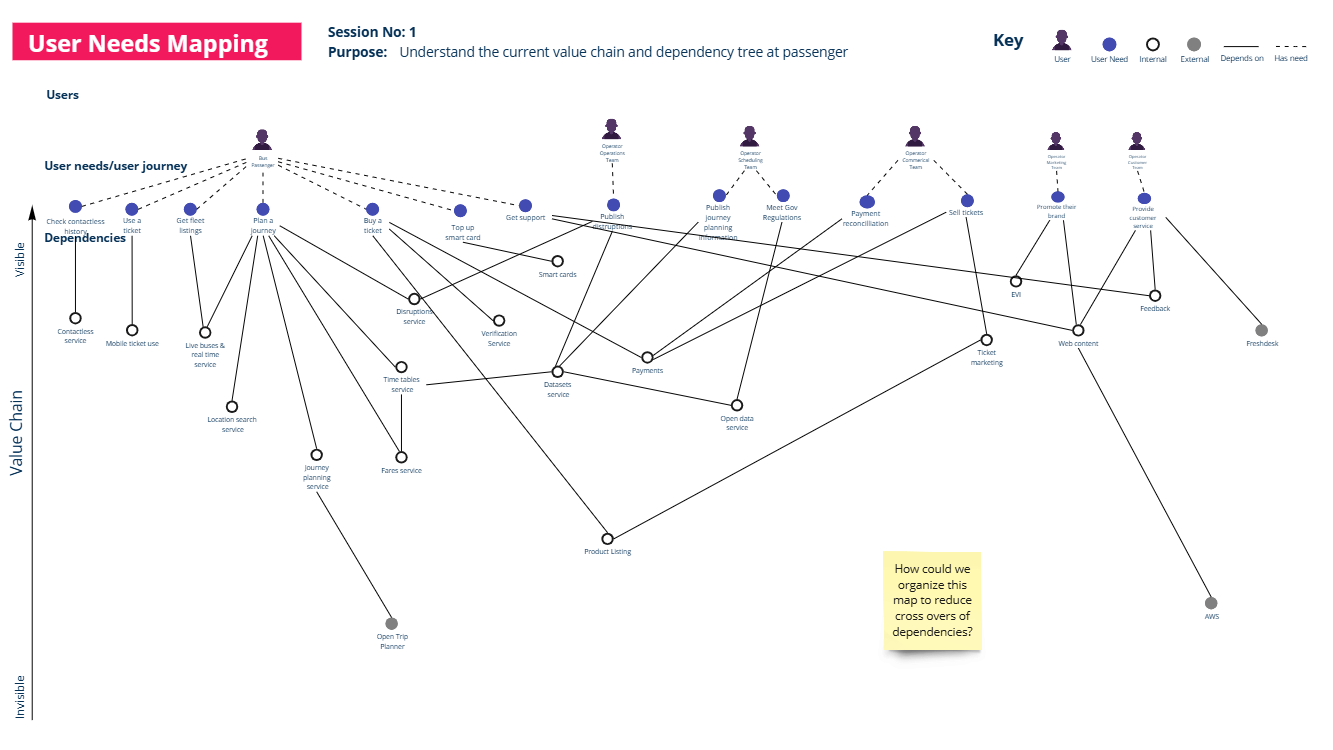
After the initial needs have been defined, the team then mapped organisational capabilities to these needs, creating a dependency tree or value chain to visualise the relationships. The capabilities are the combination of people, processes and technology that are used to meet the needs of users.
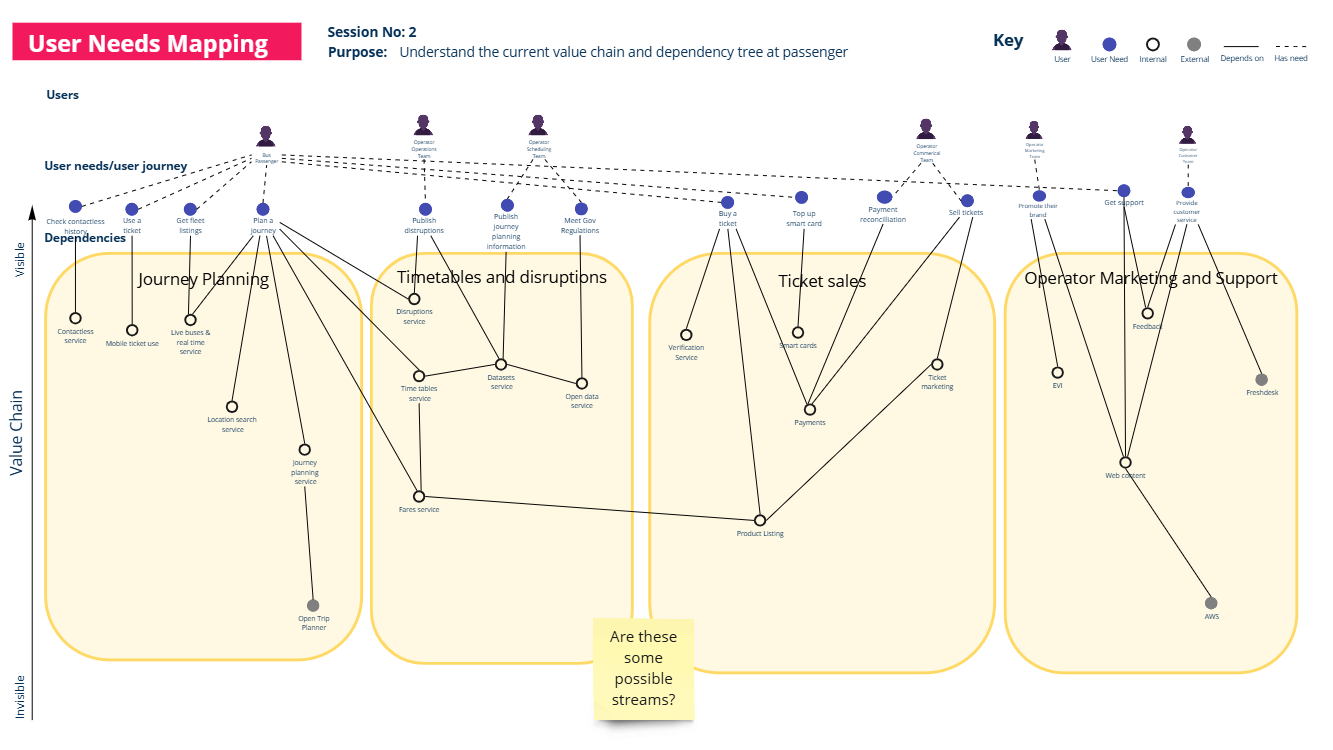
For example, for a Bus Passenger to “Plan a journey” they depend on access to a “Live bus information service” and a “Journey Planning Service” which depends on an external component know as the “Open Trip Planner”. They also need direct access to the “Fares service” and the “Timetables service” which is also dependent on the “Fares service”.
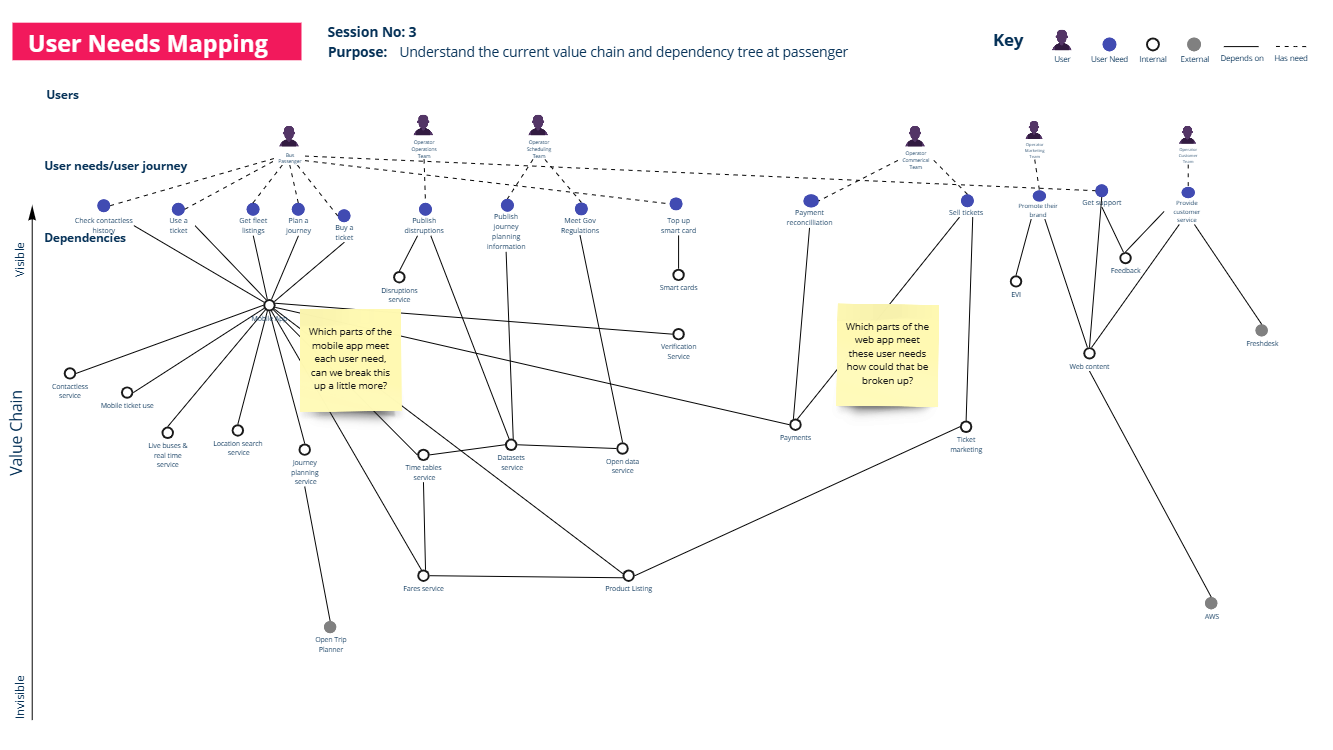
The following image shows an iteration that shows how all of these current capabilities are brought together through the mobile application, this prompted the team to consider whether there were opportunities to break up the ownership of the mobile application in some way.
As each user and their associated needs and capabilities are mapped, the big picture starts to emerge. The mapping process begins to reveal the “big ball of mud” that Dave, the CTO, was referring to. The visualisation of the dependency chain was an initial revelation for the team and helped them to understand the complexity of the current situation. They also overlaid their existing team structure on the map and quickly saw the problem: one large team owned all capabilities - their cognitive load was through the roof.
Through a series of exploratory workshops using the map as the focal point, the team at Passenger began to explore and identify potential team boundaries by seeking to group capabilities that served similar needs. The process involves moving the dependencies and user needs around to see how the capabilities might be grouped in a way that reduces dependencies between the teams that own the capabilities.
After a few iterations, the team arrived some initial suggestions for team boundaries:
A “Journey Planning” team was proposed to handle scheduling tools and journey planning interfaces.
A Timetables and disruptions team was proposed to own the capabilities related to meeting the needs of the Operator operations and scheduling teams the timetables and disruptions.
A “Ticketing and Payments” team was proposed to own all capabilities related to buying and validating tickets.
A “Operator Marketing and Support” team was proposed to own the capabilities related to supporting the end-users of the transport operators.
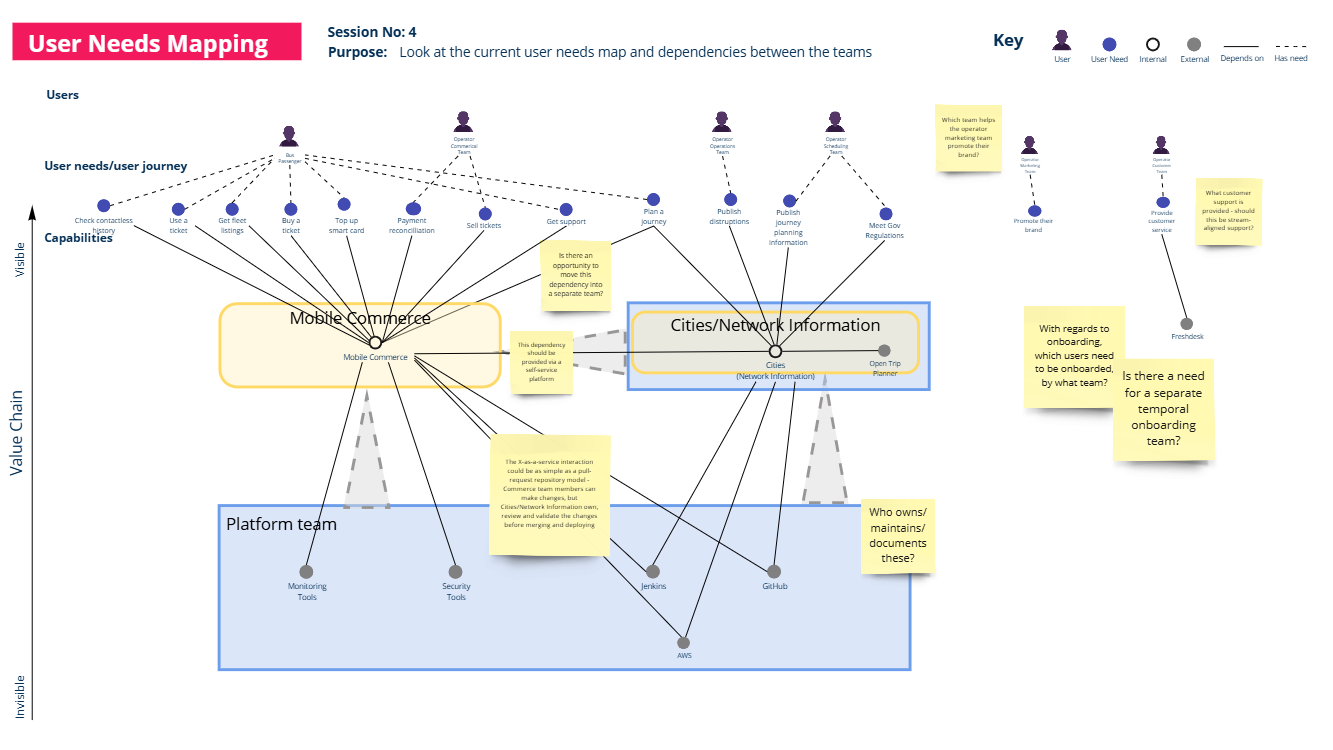
The intention of these boundaries aimed to reduce dependencies between teams while ensuring each team had clear ownership of its domain. Discussions continued and the team reached the conclusion that despite these proposed boundaries be viable in the future, they did not have sufficient people to form four full teams - this was something to aim for but they needed to consolidate the capabilities into fewer teams. The decision was made to explore two main value streams:
Mobile Commerce - a team focused on the whole mobile passenger experience.
Cities/Network Information - a team focused on meeting the needs of the Operators but also providing services to the mobile commerce team.
Thinking about Team Topologies, you may observe that in this instance, the Cities/Network Information team is acting as both a stream-aligned team (serving the needs of the external users i.e. the Operators) and a Platform team (serving the needs of the mobile commerce team). In a start-up/scale-up environment, this is a very common pattern and many platforms emerge from stream-aligned teams. The obvious challenge here is the reality that the Cities/Network Information team would need to be able to serve both the needs of the Operators and the mobile commerce team which would could have a negative impact on the speed of delivery of the mobile commerce team due to context switching or prioritisation challenges due to multiple stakeholders. However, the team acknowledged this and were mindful to monitor how the teams were performing and make adjustments as needed.
During further investigations it was also identified that there were some shared capabilities such as monitoring tools, security tools, CI/CD pipelines etc. These would be used by both of the stream-aligned teams and it made sense to consider a team to own these capabilities. This would help to reduce duplication and improve efficiency.
The Results: Clarity and alignment
By adopting the new team structure, Passenger achieved several key outcomes:
1. Improved alignment
Teams were better aligned with the needs of their users. Each team’s responsibilities were clear, and their focus areas were well-defined.
2. Reduced cognitive load
Breaking down the large, multi-functional team into smaller, focused teams reduced cognitive load, enabling team members to work more effectively.
3. Faster flow of value
Clear ownership of capabilities allowed teams to make decisions faster, leading to quicker delivery of features and updates.
4. Scalability
The new structure provided a scalable foundation as Passenger continued to grow. Future team evolution could be guided by the same User Needs Mapping principles.
Passenger’s journey highlights several important lessons for organisations considering User Needs Mapping:
Start with users: Focusing on user needs ensures that team structures align with delivering value.
Visualise dependencies: Mapping capabilities reveals bottlenecks and opportunities for improvement.
Iterate: Team boundaries should evolve over time as user needs and organisational goals change.
Lessons learned
User Needs Mapping helped Passenger navigate the complexities of growth and transition from a chaotic, overloaded structure to a streamlined, user-focused organisation. By starting with their users and mapping their needs, they unlocked a scalable and efficient team design that positioned them for future success.
If your organisation is facing similar challenges, consider starting with a User Needs Mapping exercise. It’s a practical and accessible way to uncover insights, align teams, and deliver value with greater clarity and efficiency.

“User Needs Mapping gave us a completely new way to see how our teams connect to user outcomes. It revealed opportunities to organise more effectively and played a crucial role in how we applied Team Topologies at Passenger.”
Tom Quay, CEO, Passenger