
Passenger Case Study
From chaos to clarity
Passenger had grown from a small, closely connected product company into a scaling provider of mobile ticketing solutions for public transport operators. As demand increased, so did the complexity of the product, the architecture, and the team interactions needed to support it.
What had once worked through shared context and informal communication was beginning to strain. Daily standups involved almost everyone because it was the only reliable way to stay informed. Responsibilities were becoming harder to see. Dependencies were multiplying. The team was carrying more cognitive load than was sustainable.
Passenger’s CTO, Dave Hulbert, described the situation simply:
“It just all feels like a big ball of mud.”
User Needs Mapping helped Passenger make sense of that complexity. By mapping users, needs, capabilities, dependencies, and team ownership, the team could see how value flowed through the organisation, where responsibilities were unclear, and where new team boundaries might reduce friction.
The challenge
How Passenger used User Needs Mapping to rethink team boundaries
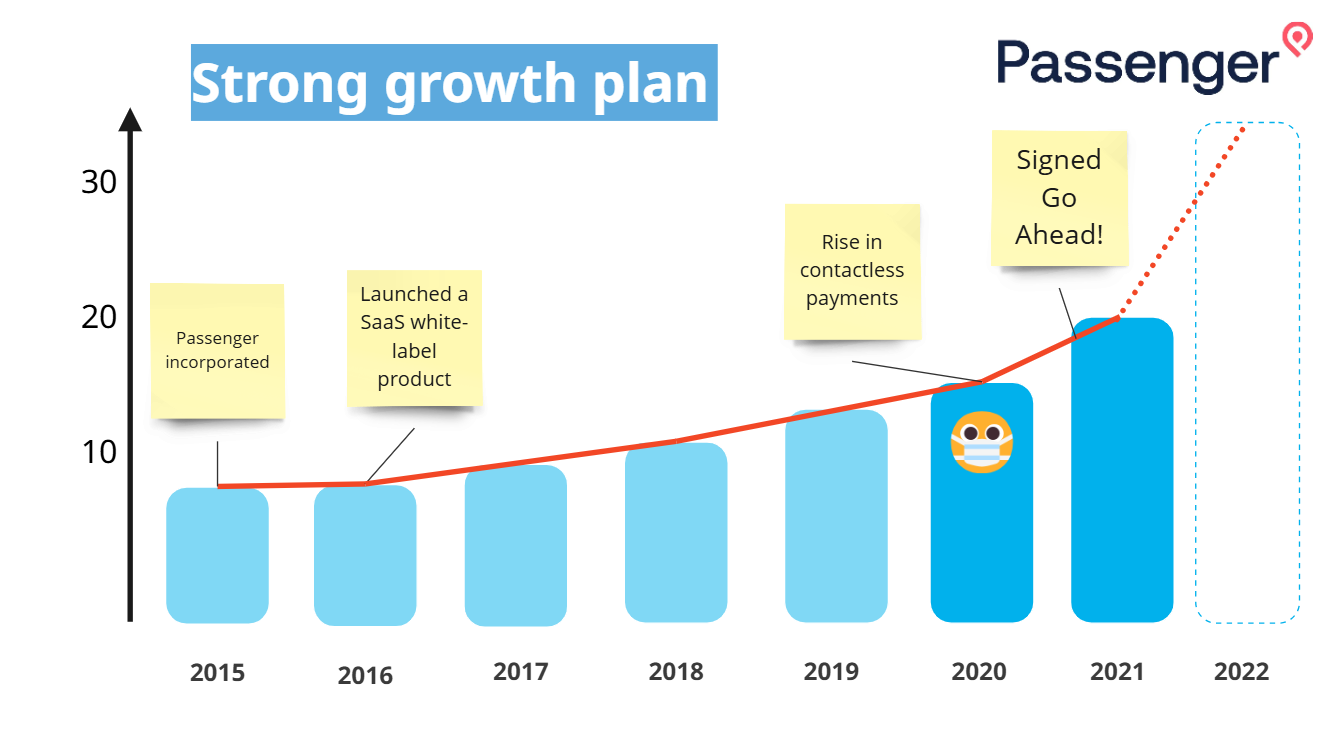
Passenger began in 2015, providing white-label mobile ticketing solutions for public transport operators. By 2020, the company had grown significantly, accelerated by the shift towards contactless payments during the COVID-19 pandemic and a major deal with Go-Ahead, one of the UK’s largest transport operators.
This growth was positive, but it exposed the limits of the existing team setup.
One large team was involved across a broad product and technology landscape: passenger-facing mobile experiences, operator tools, ticketing, payments, journey planning, timetables, disruptions, support tooling, and shared services.
The team had deep product and technical knowledge, but too much of that knowledge was held in people’s heads. As the product grew, it became harder to maintain a shared understanding of how everything fitted together.
The Approach
Passenger used User Needs Mapping to create a shared view of the current landscape.
Rather than starting with the existing org chart or asking “what teams should we have?”, the work began outside-in:
Who are the users Passenger serves?
What are those users trying to achieve?
What capabilities are required to meet those needs?
How do those capabilities depend on each other?
Which teams are currently involved?
Where is ownership unclear, overloaded, or fragmented?
This created a different kind of conversation. Instead of debating structure in the abstract, the team could reason from user needs into capabilities, dependencies, ownership, and cognitive load.
Starting with users and needs
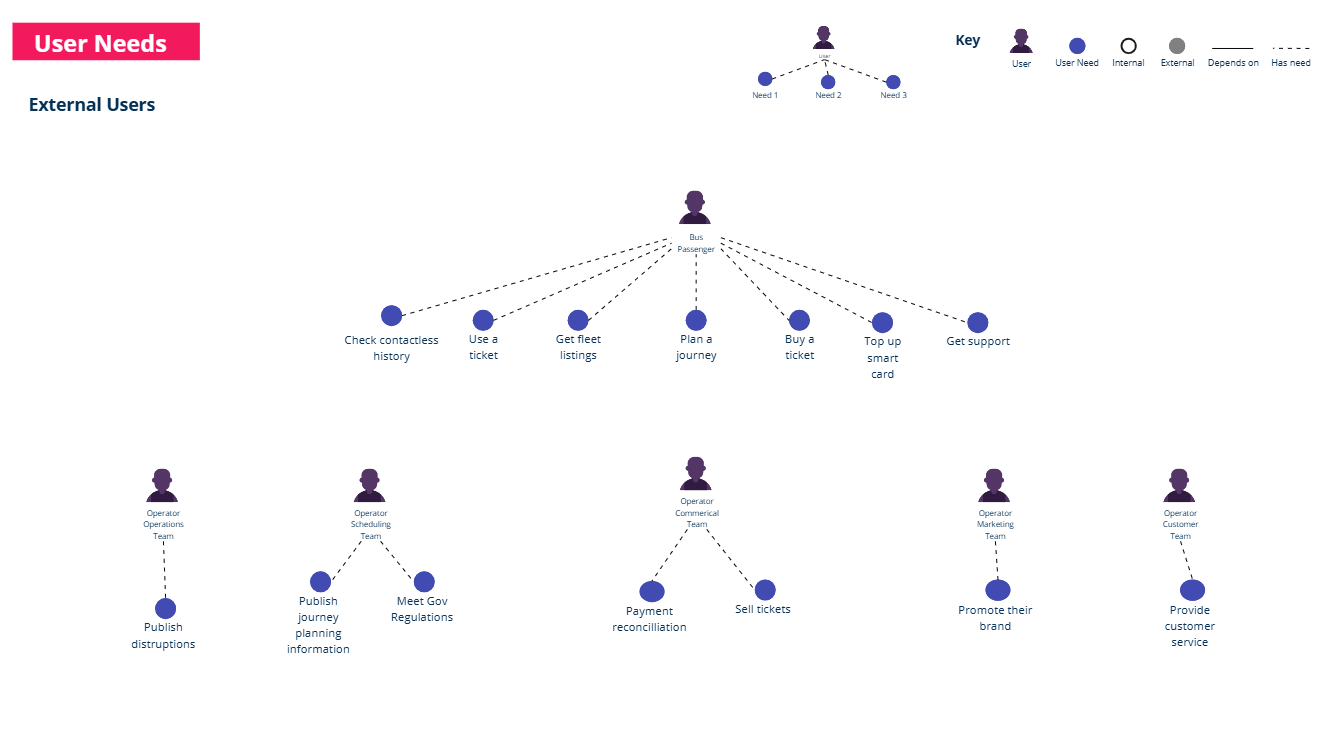
The first step was to identify the users interacting with Passenger’s products and services.
These included bus passengers using the mobile app to plan journeys, buy tickets, access travel information, and board buses. They also included transport operators and their scheduling, operations, marketing, and customer service teams.
Internal users were also considered, including Passenger’s own customer support and client success teams.
The team then captured what each group needed from Passenger’s systems. For example, a bus passenger might need to plan a journey, buy a ticket, or use that ticket to board a bus. An operator scheduling team might need to publish accurate timetable data or meet government reporting requirements.
Some of these early statements were closer to activities than deeper needs. That was useful rather than problematic. It gave the team a practical starting point and created the raw material for deeper refinement later.
For example, “buy a ticket” could later be reframed as “know I have valid access to travel,” opening up a wider conversation about pay-as-you-go travel, multi-modal passes, or other ways to reduce friction in the passenger experience.
Mapping capabilities and dependencies
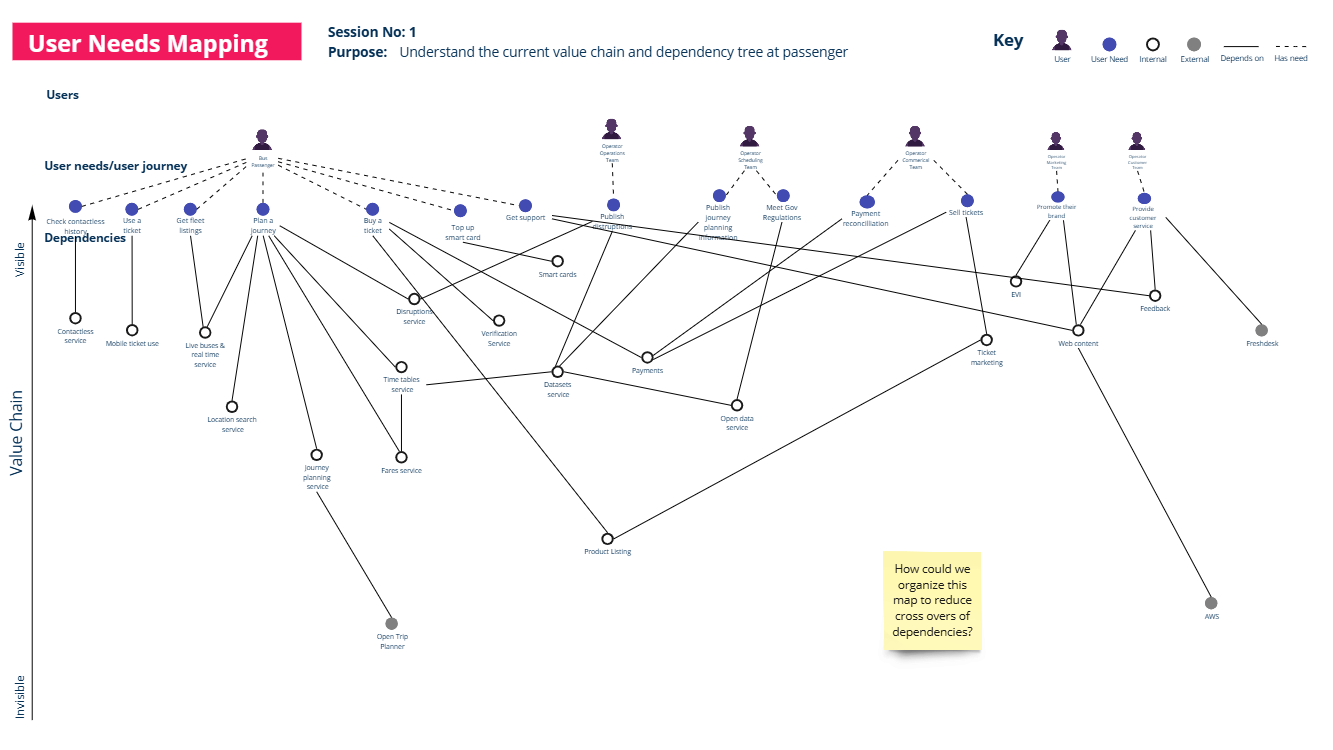
Once the users and needs were visible, the team mapped the capabilities required to meet them.
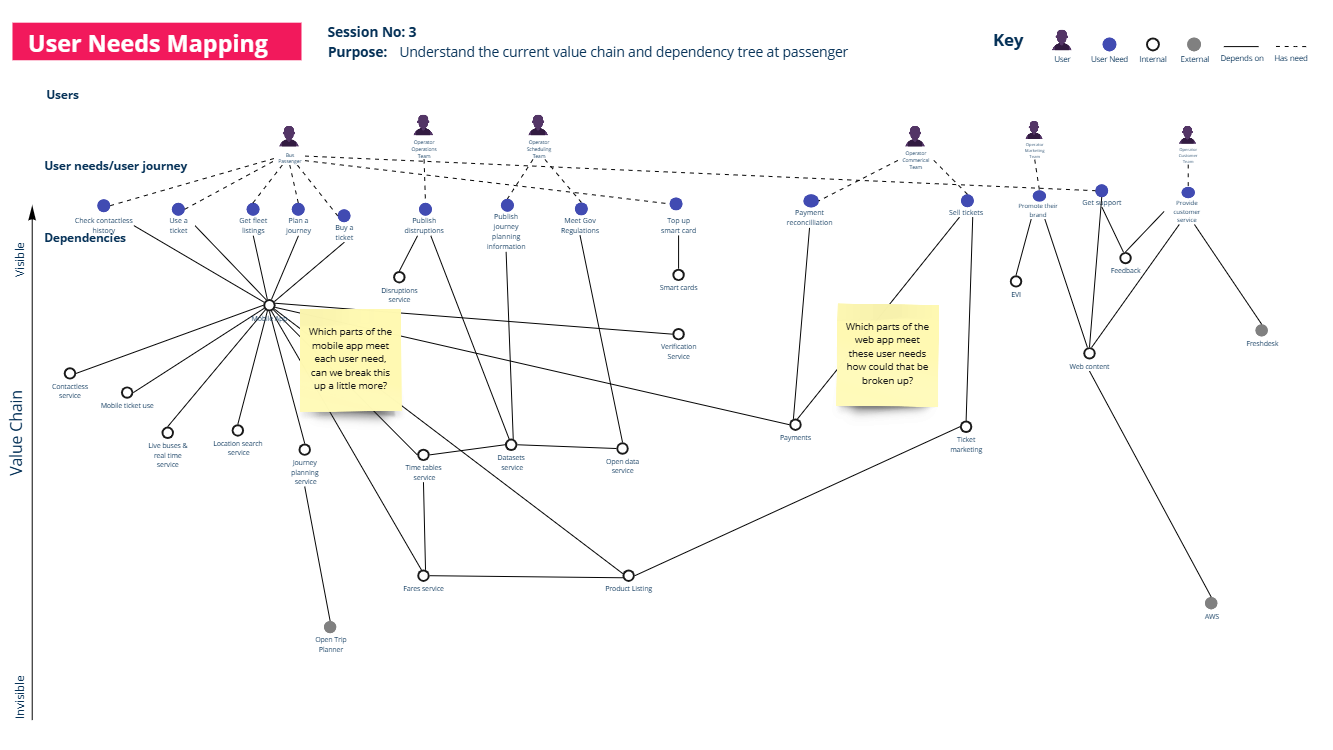
For Passenger, this included capabilities and components such as the mobile application, journey planning, live bus information, fares, timetables, disruptions, ticketing, payment processing, customer support infrastructure, and external services such as OpenTripPlanner.
The team then connected these capabilities into value chains.
For example, when a bus passenger needs to plan a journey, they may use the journey planner in the mobile app. The mobile app depends on the journey planning service. That service depends on timetable data, fares data, disruptions information, live bus information, and external planning capabilities.
This helped the team move from individual mental models to a shared picture of how value was actually delivered.
The complexity had always been there, but the map made it visible.
Making ownership and cognitive load visible
The next step was to overlay the current team structure onto the map.
This revealed one of the central issues: the same large team appeared across many different parts of the value chain. It was involved in different user needs, different areas of the product, and different technical capabilities.
That made the cognitive load visible.
The team was not simply busy. It was stretched across too many contexts. People were switching between passenger-facing experiences, operator-facing services, ticketing, payments, timetable data, disruption information, support tooling, and shared technical capabilities.
The map also highlighted areas where ownership was unclear. Some capabilities had many people involved, but no obvious team responsible for their ongoing health and evolution.
This shifted the conversation from “how do we coordinate better?” to “how could we reduce the need for so much coordination in the first place?”
Exploring new team boundaries
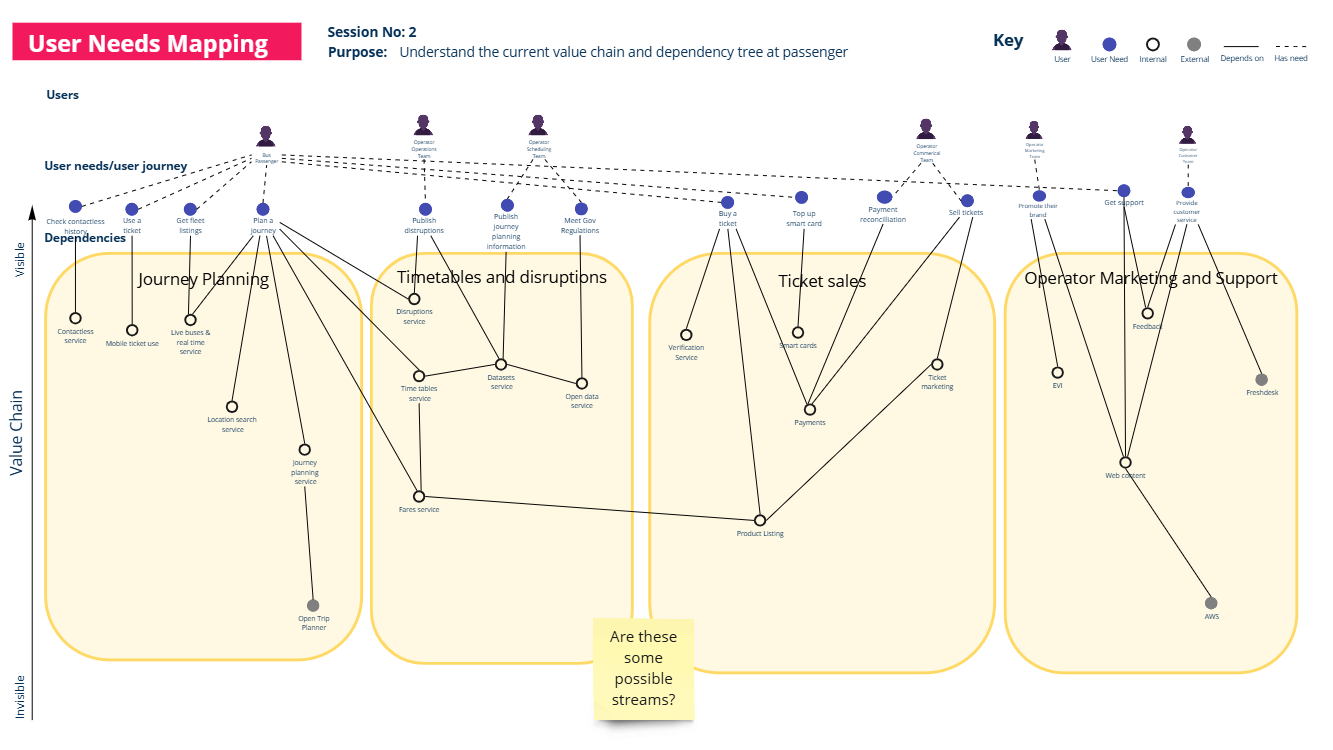
With the current landscape visible, Passenger explored potential team boundaries by looking for clusters of capabilities that naturally belonged together.
Several options emerged:
A Journey Planning team focused on journey planning services, scheduling tools, real-time information, and passenger travel information.
A Timetables and Disruptions team focused on the capabilities needed by operator operations and scheduling teams.
A Ticketing and Payments team focused on buying, storing, validating, and managing tickets.
An Operator Marketing and Support team focused on branding, feedback, customer support, and operator-facing services.
These options helped the team reason about how responsibilities could be grouped around user needs and value streams, rather than around the existing shape of the organisation.
The four-team model was useful, but it was not immediately viable.
Passenger did not yet have enough people to form four fully independent teams with the skills and capacity required to own each area effectively. Creating four teams too soon would have risked spreading people even thinner.
Instead, the team consolidated the options into two primary value streams.
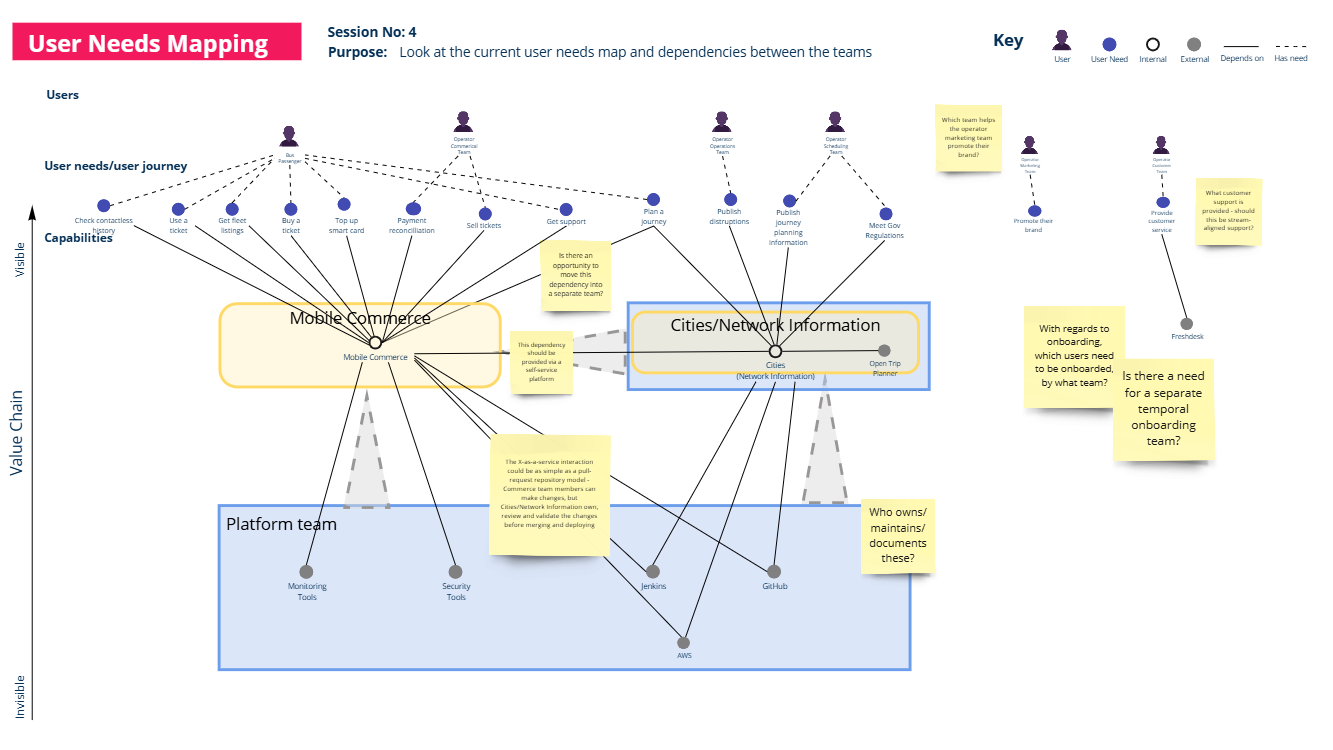
Mobile Commerce focused on the passenger-facing mobile experience, from ticket purchase through to travel support.
Cities / Network Information focused on meeting the needs of transport operators while also providing important services to Mobile Commerce, such as schedule data, routes, network information, and pricing-related capabilities.
This was not treated as a perfect end state. It was a pragmatic step towards a more scalable team design.
The Cities / Network Information team had a hybrid role: serving external operator needs while also providing internal services to Mobile Commerce. The trade-off was recognised. It could create priority tension or context switching, but the important thing was that the risk was now visible and could be monitored as the organisation evolved.
Recognising shared capabilities
The mapping also surfaced shared technical capabilities that did not naturally belong inside either value stream. These included areas such as monitoring, security tooling, CI/CD pipelines, and other internal capabilities used by multiple teams.
Rather than duplicating this work, Passenger could begin to consider whether some of these capabilities needed clearer ownership as shared internal services. This created a more intentional route towards platform thinking: not by creating a platform team by default, but by identifying where shared capabilities could reduce friction and provide leverage across teams.
A pragmatic decision
What changed
The value of the work was not simply the map itself. It was the clarity the map created.
Passenger gained a shared view of how passenger-facing and operator-facing needs depended on a wider set of capabilities, services, and technical systems. They could see where one large team was carrying too much context, where ownership was unclear, and where new boundaries could reduce friction.
The work helped Passenger:
build a clearer shared understanding of the product and service landscape
make ownership and dependencies easier to discuss
identify where cognitive load was becoming unsustainable
explore team boundaries grounded in user needs and capabilities
move towards a more scalable structure without forcing an unrealistic reorganisation
The result was a more deliberate direction of travel: clearer ownership around Mobile Commerce and Cities / Network Information, supported by a growing awareness of shared platform-like capabilities.
What other organisations can learn
Passenger’s experience is familiar to many scaling organisations.
Early ways of working often rely on everyone knowing enough about everything. That can work when the team is small and the product is contained. But as the organisation grows, the same habits can create friction.
More meetings are added to compensate for unclear ownership. More coordination is needed because responsibilities are spread across too many areas. More people need to be involved in decisions because the boundaries are not clear enough.
User Needs Mapping helps by changing the starting point.
Instead of beginning with teams, systems, or reporting lines, it begins with users and needs. From there, it traces the capabilities required to meet those needs, the dependencies between those capabilities, and the teams currently responsible for them.
For Passenger, the map did not remove all complexity. That was never the aim. It helped the team understand which complexity mattered, where ownership was unclear, and where new boundaries could reduce cognitive load and improve flow.
Closing
Passenger’s journey shows how User Needs Mapping can support team design in a scaling organisation without jumping straight to a reorganisation.
By starting with users and needs, the team built a shared understanding of the current landscape, surfaced hidden dependencies, and explored more coherent team boundaries.
When delivery starts to feel harder than it should, the answer is not always more coordination. Sometimes the first step is to make the current system visible, reconnect it to user needs, and use that shared understanding to decide where change would make the biggest difference.

“User Needs Mapping gave us a completely new way to see how our teams connect to user outcomes. It revealed opportunities to organise more effectively and played a crucial role in how we applied Team Topologies at Passenger.”
Tom Quay, CEO, Passenger